THE RELIGION GUY’S ANSWER:
Candidate Donald Trump won Michigan by 1.41%, Pennsylvania by 1.7%, and Wisconsin by 0.86%. If Kamala Harris could have overcome those three small margins she’d be president, barely carrying the Electoral College. Trump also had slim margins in Georgia (2.18%) and New Hampshire (2.78%). In 2028, these and a few other hotly contested states will presumably make the difference once again.
The tiny and ulcer-inducing Republican majority in the U.S. House is up for grabs in 2026. Looking just at those five states, the authoritative Cook Political Report rates three Republican-held seats as tossups plus three that only “lean” GOP, with zero Democratic tossups and one “leaning.” (Republicans’ chances to continue Senate control look brighter, with hopes to flip Democratic seats in Georgia and Michigan as well as New Hampshire.)
All of which underscores the nation’s close — and bitter – political divide. More than ever, strategists need to assess the sometimes-neglected religion factor, and especially Democrats, who’ve slowly but steadily lost favor with so many churchgoers. Now the Pew Research Center has issued an information-rich resource, a 392-page report on its latest Religious Landscape Study. See www.pewresearch.org/religion/2025/02/26/decline-of-christianity-in-the-us-has-slowed-may-have-leveled-off/.
46 vs. 46
Pew finds a notable even split with 46% of Americans identifying or leaning Democratic and 46% Republican. On religion, respondents identified as “evangelical” Protestant (23%); Catholic (19%); “mainline” Protestant (11%); Protestants in Black denominations (5%); Jews (2%); Latter-day Saints (2%); around 1% each for Orthodox Christians, Buddhists, Hindus, and Muslims; 5% with other or no choices; and then religiously unaffiliated “nones,” who’ve increased to a striking 29% of Americans.
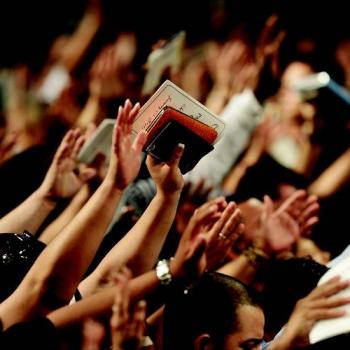
A pre-election 2024 Pew poll showed that religiously the Democratic coalition involved majorities of Black Protestants (84%), unaffiliated “nones” (70%), Jews (69%), Muslims (66%) and Hispanic Catholics (60%). The Republicans held majorities of white evangelicals (85%), Latter-day Saints (75%), non-Hispanic white Catholics (61%, a crucial increase over the years), and mainline Protestants (58%). Hispanic Protestants, a group to watch, fell 49% Republican and 45% Democratic.
The massive Pew sample of 36,908 respondents enables unique breakdowns on religion state by state. With those five “battlegrounds,” Georgia is more devout than average and New Hampshire quite secular, with Michigan, Pennsylvania and Wisconsin in between like Americans in general. Facts on the ground for politicos and journos to ponder:
State by State
Georgia (16 Electoral College votes) – Though both U.S. senators are Democrats, all statewide elected officials are Republicans and the party has won both legislative chambers in 21 straight elections. Similar to the Southeast generally, the population is a hefty 33% evangelical Protestant with substantial numbers in Black Protestant denominations (14%), and weaker showings by mainline Protestants (10%) and Catholics (8%). Then 26% are “nones.”
Among Georgians, 66% “absolutely” believe in God or a “universal spirit,” 56% say they pray daily, 27% worship weekly, 57% find the Bible “extremely” or “very” important, and 75% feel their religion is personally “very” or “somewhat” important (compared with 64% of Americans over-all).
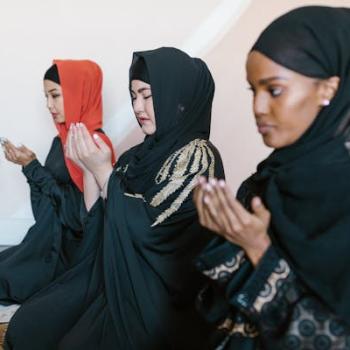
Michigan (15 votes) – The Christian majority is divided into evangelicals (21%), Catholics (19%), mainline Protestants (14%) and Black Protestants (5%). Unaffiliated “nones” claim 31%. Michiganders fell 54% on the God question and 43% on the Bible question, while 44% say they pray daily. There’s much talk about the state’s Muslim voters but they’re only 1%, the same as for Jews. (See below on Muslims nationwide.)
New Hampshire (4 votes) – Remarkably, Christians are a minority here and 48% are religious “nones.” Catholics (20%) and mainline Protestants (13%) notably outpace evangelicals (only 10%), and Black Protestants (a mere 1%). In this state only 25% pray daily, 13% worship weekly, 41% feel religion is important, 22% see the Bible as important, and 33% “absolutely” believe in God.
Pennsylvania (19 votes) – Catholics (at 22%) have the edge over evangelicals (19%), mainline Protestants (15%), Black Protestants (5%), and Jews (2%). The “nones’ total 30%. Pennsylvanians are spiritual middle-roaders with 40% praying daily, 50% “absolutely” believing in God, 22% worshiping weekly, 61% seeing religion as important, and 39% seeing the Bible as important.
Wisconsin (10 votes) –There’s a close Christian divide among Catholics (20%), evangelicals (19%), and mainline Protestants (18%), with 2% in the Black denominations. The “nones” are above average at 34% This state is nearly identical to Pennsylvania as 22% worship weekly, 38% pray daily, 50% have absolute belief in God, 60% feel religion as important, and 34% see the Bible as important.
And then public policies
Finally, some numbers on religiously tinged public policies. Pew found that 58% of unaffiliated “nones,” and 59% of Jews, think growing acceptance of transgendered people – a major Trump concern — is a “change for the better,” compared with 48% of Muslims and 47% of Christians overall.
On the Supreme Court’s legalization of gay marriage, Catholics are in favor by 70% (up from 57% in the previous 2014 Landscape) and Black Protestants by 56% (up from 40%). Evangelicals remain opposed by 62% and Latter-day Saints by 56%.
On abortion, evangelicals (at 65%) and Latter-day Saints (at 69%) believe the practice should be illegal in all or most cases. With Catholics and most other religious segments, varying majorities think it should be legal in all or most cases.
On immigration, a factor in Trump’s 1.5% popular vote victory, majorities in all religious categories and at all levels of involvement believe a wide variety of races and national backgrounds is a strength of American society. But evangelicals are more wary than others with 45% thinking “we risk losing our identity as a nation if America is too open to people from all over the world.” Among all respondents, 35% say the growing immigrant population is good for the U.S., 38% say it’s “bad,” and 38% say it makes little difference.
Side note on the nationwide total for Muslims. Best estimates include 3.45 million by Pew Research, 4 million in 2,769 mosques in a 2020 survey run by Muslims, 4.454 million in 2,771 mosques per scholars’ 2020 Religion Census, and 4.9 million as of 2020 in the World Christian Encyclopedia. (Some previous higher numbers probably missed that many Americans with Arabic surnames are Christians.)